
Goal
Apply a chosen percentage improvement to a current race time and show the faster target, seconds saved, and equivalent minutes saved.
Worldwide context
Saved once here, used across the site.
Currency changes display only. Country selection guides tax input; no tax rate is guessed.
Apply a chosen percentage improvement to a current race time and show the faster target, seconds saved, and equivalent minutes saved.
Target time = current time × (1 − improvement percentage ÷ 100); time saved = current time − target time.A clearer path to an answer
This page keeps the calculation transparent: define the goal, enter the matching values, inspect the method, and decide what the result means in your situation.
Apply a chosen percentage improvement to a current race time and show the faster target, seconds saved, and equivalent minutes saved.
Current hours · Current minutes · Current seconds · Target improvement
Target time = current time × (1 − improvement percentage ÷ 100); time saved = current time − target time.
Calculate, review the assumptions below, then compare a related tool when the decision needs more context.
Apply a chosen percentage improvement to a current race time and show the faster target, seconds saved, and equivalent minutes saved.
Open the Race Time Improvement Calculator pageMore sports tools
Download PDFDownload Word (.doc)
Enter your values above and choose Calculate to see the result here.
Calculation map
Target time = current time × (1 − improvement percentage ÷ 100); time saved = current time − target time.
Bounded, transparent calculation
Your recent runs stay in this browser session only.
Formula: Target time = current time × (1 − improvement percentage ÷ 100); time saved = current time − target time.
A percentage improvement in elapsed time is a planning scenario: the target is the current duration multiplied by the fraction that remains. The page keeps the saved seconds visible because the same percentage represents different absolute gains for different race durations.
Worked example: A 48:35 result with a 5% time improvement target becomes 46:09.25, saving 145.75 seconds.
The displayed limits are checked before the handler runs. Model-specific domain checks may also reject impossible or non-finite inputs.
Methodology: This calculator follows the WorldCalculate input, formula, precision, and boundary policy. Read the official methodology.
Calculator usage statistics
This section counts anonymous successful Calculate submissions, not unique visitors. Counts and top tools appear only when trusted aggregate data is available; country analysis is shown only under the same condition and reporting threshold.
Answer-first guide
Apply a chosen percentage improvement to a current race time and show the faster target, seconds saved, and equivalent minutes saved. Start with one clearly defined goal, enter values in the units shown, and keep the result attached to the assumptions below.
This tool is useful when your question includes race time improvement calculator, running time improvement, target race time. It returns the outputs declared in the calculator contract rather than a live quote, approval, diagnosis, or professional sign-off.
Current hours · Current minutes · Current seconds · Target improvement. Keep the same time period, unit system, and currency wherever the form requires comparable values.
Run the worked example first, compare its output with the page's example, then change one input at a time. This makes an unexpected result easier to trace to a unit, boundary, or assumption.
Need a wider view? Browse Sports Statistics Calculators or compare the related tools below. The WorldCalculate methodology explains how formulas, examples, limits, and revisions are reviewed.
Target time = current time × (1 − improvement percentage ÷ 100); time saved = current time − target time.
A percentage improvement in elapsed time is a planning scenario: the target is the current duration multiplied by the fraction that remains. The page keeps the saved seconds visible because the same percentage represents different absolute gains for different race durations.
A 48:35 result with a 5% time improvement target becomes 46:09.25, saving 145.75 seconds.
Context and background
A sports percentage or rate depends on attempts, outs, minutes, shots, or another denominator. Matching that definition is necessary before comparing players, teams, or seasons.
Box-score analysis became more useful as raw events were expressed as rates that account for opportunities. These tools show the denominator so the result remains tied to the supplied record.
Research and review
Researched by Hassan ALRowaie, Founder and editorial researcher at WorldCalculate.
This guide follows the live calculator's declared inputs, formula, worked example, assumptions, validation boundaries, and source-backed methodology. The review date describes editorial review of the calculator explanation; it is not a promise that external facts or rates remain current.
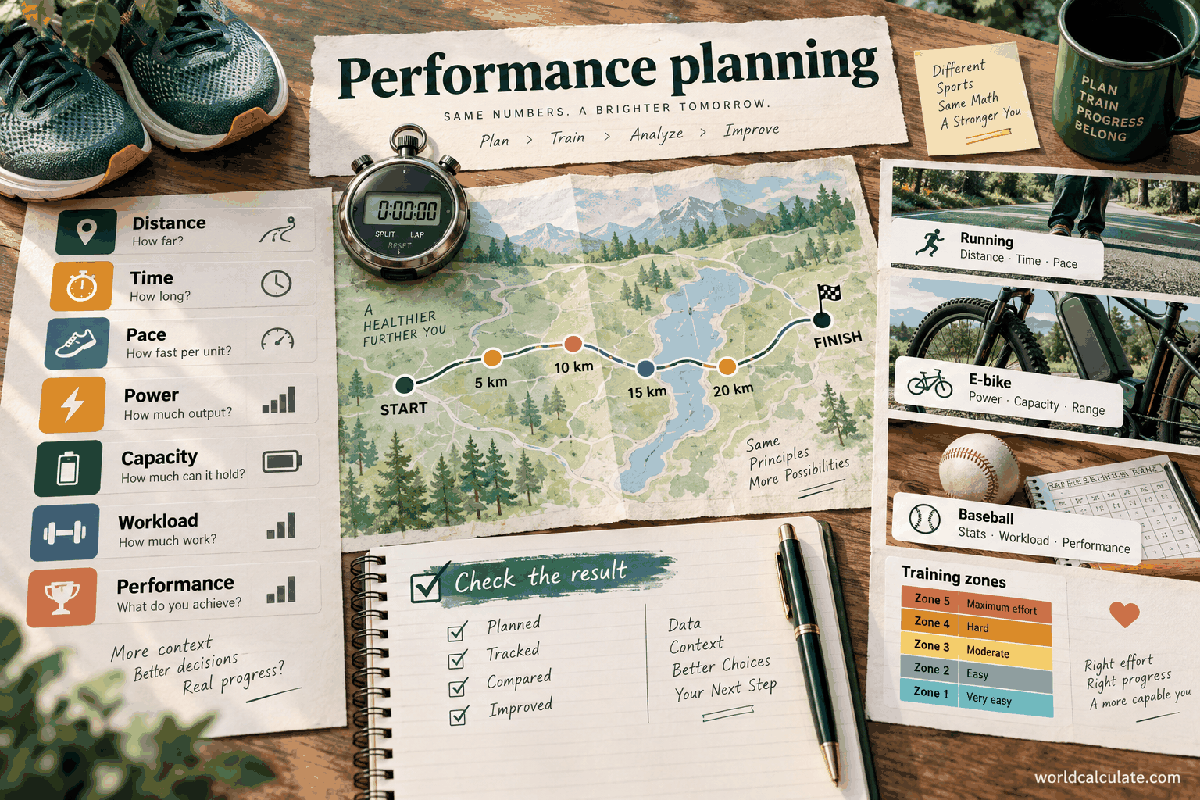
A race goal is more useful when a percentage is translated into a clock time. This calculator treats improvement as an explicit scenario, shows the time saved, and keeps the boundary clear between arithmetic planning and the many factors that determine real performance.
If a runner wants to reduce elapsed time by a chosen percentage, the target keeps the complementary percentage. A 5% time improvement means 95% of the original duration remains. The calculation starts from the entered result rather than assuming every race has the same distance or course conditions.
A shorter time over the same distance implies a higher average speed, but the percentage changes are not identical. This page applies the percentage to elapsed time because that is the quantity the visitor is targeting. Pace, speed, and split targets can be built in a separate step after the target time is chosen.
Convert hours, minutes, and seconds to total seconds. Multiply by one minus the improvement fraction. Subtract the target from the current time to obtain the absolute saving. Showing all three stages makes the result auditable when a coach or training partner reviews it.
A current result of 48 minutes 35 seconds equals 2,915 seconds. A 5% improvement leaves 95% of that duration, or 2,769.25 seconds. The target is 46 minutes 9.25 seconds and the saving is 145.75 seconds. Rounding the display does not change the underlying scenario logic.
The same percentage of a longer duration represents more clock time. A 5% target can therefore mean a small number of seconds in a short event and several minutes in a marathon. Compare both the percentage and the saved time before deciding whether two goals have similar practical difficulty.
Once the target time is selected, divide it by course distance to create an average pace, then break it into realistic segments. Weather, hills, turns, surface, aid stations, and race congestion can make segment targets differ from the simple average. Preserve the original result beside the target so progress is measured against a known baseline.
Percentage arithmetic cannot estimate adaptation, fatigue, illness, injury, experience, or the conditions on race day. A target is best treated as one scenario among a conservative, expected, and ambitious range. Adjust training responsibly and use qualified advice for health or injury questions.
Write down the event distance, course, date, current time, chosen improvement percentage, target time, and assumptions about conditions. When a new result arrives, run the same calculation again from the new baseline. This creates a useful progress history without confusing a planned target with an official performance prediction.
Before entering a percentage, decide what the target is meant to support. A runner may be choosing a realistic next race goal, a coach may be building a pace worksheet, or a student may be checking a percentage-decrease lesson. The same formula can answer each question, but the useful interpretation changes. A training goal should lead to a process and checkpoints, while a classroom answer should show units and rounding.
Write the decision in one sentence: reduce the official 10 km time by 3%, estimate a marathon pacing scenario, or compare two baseline performances. This prevents a pleasing number from becoming a vague promise. A clear purpose also tells you which additional calculator or record is needed next, such as pace, split, distance, or unit conversion.
Mixed clock fields can hide arithmetic mistakes. Convert hours to 3,600-second blocks, minutes to 60-second blocks, and then add the seconds. Apply the improvement fraction to that single duration. Only after the target is calculated should you split seconds back into hours, minutes, and seconds. This avoids accidentally applying five percent to minutes while leaving seconds untouched.
For example, 1 hour 42 minutes 30 seconds is 6,150 seconds. A 4% time reduction leaves 96% of the duration, or 5,904 seconds. That is 1 hour 38 minutes 24 seconds. The percentage was applied once to the complete duration, and the final clock format is only a readable representation of the result.
If distance is fixed, average speed is distance divided by time. Reducing time to 95% of the original makes speed equal to the original speed divided by 0.95, which is about 1.0526 times the original speed. That is a speed increase of about 5.26%, not exactly 5%. This distinction is important when a goal is described as five percent faster in conversation.
Use this calculator when the input is a percentage reduction in elapsed time. If the athlete’s plan is expressed as a speed or pace increase, convert that goal explicitly and check the resulting time separately. Keeping time improvement and speed improvement as different scenarios makes the target easier to explain and avoids false precision in a training plan.
A 5% improvement in a 5 km time and a 5% improvement in a marathon time are mathematically comparable percentages, but they are not equivalent physiological tasks. The longer event has more minutes to save and more opportunities for pacing, fueling, weather, and fatigue to affect the result. Never compare the percentages alone when the event distance or discipline changes.
Record distance, elevation, surface, and event format beside the output. A trail race, road race, track time trial, and indoor treadmill result can all be called a race time while representing different demands. The calculator is intentionally distance-neutral; the visitor supplies the context needed to decide whether two scenarios belong in the same comparison.
For a fixed distance, average pace is target time divided by distance. If the target is 46 minutes 9.25 seconds for 10 km, the average is 276.925 seconds per kilometre, or about 4 minutes 36.93 seconds per kilometre. That average is a planning reference, not a requirement to run every kilometre at exactly the same split.
Use course features to turn the average into a pacing plan. Climbs, turns, wind, aid stations, and crowded starts can make a slightly slower split appropriate in one section and a faster split in another. Keep the target total unchanged while allowing the individual splits to reflect the actual course rather than chasing a calculator-generated number at every moment.
A useful worksheet lists distance segment, planned split, cumulative time, terrain, and an adjustment note. For a 10 km target, five 2 km segments might be easier to monitor than ten isolated kilometre targets. Add the segment durations and confirm that their sum equals the target seconds. This catches a missing aid-station pause or a copied split before race day.
If you use a negative split, the early segments should be intentionally controlled and the later segments should remain physiologically plausible. Do not make the final segments so aggressive that the plan depends on an untested sprint. A range for each split can be more honest than a single second-level promise, while the calculator remains the fixed-total check.
One target hides uncertainty. Create three labeled scenarios from the same baseline: conservative, expected, and stretch. The conservative case may reflect heat or a demanding course, the expected case may reflect normal preparation, and the stretch case may require unusually favorable conditions. The difference between the scenarios is more informative than a single target copied into a training calendar.
Avoid selecting the most ambitious result because it feels motivating. A useful scenario is one that changes a decision: how you pace the first half, when you reassess effort, or which training benchmark you need to meet. Keep each percentage and resulting clock time visible so the trade-off can be discussed with a coach or training partner.
A large improvement can be decomposed into checkpoints. Start with the baseline, choose a modest reduction, and remeasure after a consistent training block or event. Each new official result becomes the next baseline rather than assuming all gains arrive at once. This lets the runner distinguish a durable improvement from one unusually favorable day.
For instance, a 5% long-term ambition can be tracked through 1%, 2.5%, and 5% scenarios. The calculator does not prescribe the interval between checkpoints; it makes the time consequence of each percentage explicit. The training record, recovery, and qualified coaching judgment decide whether a checkpoint is appropriate.
Use a baseline that is identifiable and comparable. Record whether it is an official race, a solo time trial, a workout estimate, or a predicted performance. Include distance measurement method, course certification if relevant, timing method, weather, and whether the result includes a crowded start or pauses. A target based on an uncertain baseline should be labeled as uncertain too.
Do not combine a personal-best road time with an interrupted training run without explaining the difference. When two baselines are both useful, calculate each separately and compare the scenarios rather than averaging them into an invented result. The calculator can preserve precision, but it cannot improve the quality of an input that was not measured consistently.
Time is often displayed to whole seconds, tenths, or hundredths. The internal target may contain a fraction of a second, as in 2,769.25 seconds. Keep the unrounded value for addition and comparison, then choose a display rule for the audience. Rounding a target to 46:09 can be fine for a general plan, while a timing worksheet may need 46:09.25.
Never round each split independently and assume the displayed splits still sum to the displayed finish. Calculate with full precision, distribute any rounding deliberately, and show the convention in the table heading. This is especially important when many segments are added, because small display differences can accumulate into a confusing final total.
A percentage target describes a clock relationship, not a correction for course difficulty. Heat, humidity, wind, altitude, rain, surface, elevation change, turns, and congestion can alter performance. Compare conditions before deciding that a runner missed or exceeded the underlying goal. A slower time on a harder course may represent meaningful progress even when the displayed target was not met.
If conditions are materially different, label the result as a scenario for that course rather than a direct forecast. A coach may use an effort-based plan, an adjusted comparison, or a separate performance model. This page keeps the arithmetic simple so those expert judgments remain visible instead of being hidden inside an unsupported correction factor.
A faster target can tempt a runner to add intensity or volume too quickly. The percentage calculation cannot assess injury history, recovery, sleep, nutrition, age, medical conditions, or the interaction of training sessions. Do not use the result as permission to ignore pain or to replace guidance from a qualified professional.
Use the target to define an outcome, then build training around gradual, recoverable steps. Monitor how the body responds, keep easy days genuinely easy when appropriate, and revise the target if the evidence changes. The most successful plan is not the one with the most impressive spreadsheet; it is the one that can be followed consistently and safely.
A goal is chosen; a prediction is estimated from evidence. This calculator performs neither a physiological forecast nor a race-equivalency model. It answers: if the elapsed time is reduced by this percentage, what clock time results? A visitor should not describe the output as a guaranteed finish, qualification probability, or medical performance prediction.
When a prediction is needed, collect comparable performances, recent training, course data, and environmental assumptions and use a method designed for that purpose. Link the target back to the baseline record and label the source of each assumption. Clear language builds trust: target, scenario, estimate, and official result are different terms.
A runner may want to compare a 5 km, 10 km, half marathon, or cycling event. The percentage calculation is useful within an event, but event-to-event comparisons require a distance or performance model and should not be inferred from this page. Different energy systems, pacing strategies, and course conditions make a simple percentage an incomplete equivalency.
Use this tool to create a transparent scenario for each event, then compare the records with the appropriate context. Keep the raw time, distance, and conditions available. If a visitor is studying percentages, the arithmetic remains valid; if the visitor is making a serious performance decision, the scope limitation should be part of the answer rather than a footnote.
Suppose an athlete has a 25:00 5 km baseline and wants a 2% improvement. The current duration is 1,500 seconds, the remaining fraction is 0.98, and the target is 1,470 seconds, or 24:30. The saving is 30 seconds. A worksheet can then ask whether the athlete can hold 294 seconds per kilometre across five kilometres and what intermediate test would support that assumption.
A second scenario at 4% gives 1,440 seconds, or 24:00, saving 60 seconds. Presenting both results makes the cost of the extra ambition visible. The calculator does not choose the training path; it gives the runner and coach precise clocks to evaluate against current evidence.
Recompute after a new official baseline, a change in race distance, a changed course, a new target percentage, or a correction to the original time. Also recompute when a time was entered with a pause or a clock-format mistake. Do not keep a target frozen for months while the baseline and circumstances change around it.
Save the old scenario instead of overwriting it if you want a progress history. A dated list of baseline, percentage, target, achieved time, and conditions lets a runner see whether the planning method is useful. Historical records are more actionable than a single screenshot with no explanation of the inputs.
After calculating a target time, the natural next questions are pace per kilometre, speed in kilometres or miles per hour, split planning, and percentage change between two recorded results. A helpful calculator page should guide the visitor to those related tools with descriptive link text, not a generic link that forces them to search again. Keep the current race distance and target time in the visitor’s notes so the next calculator can be filled accurately.
A second useful path is educational: percentage decrease, time-unit conversion, and rounding. A third is practical: training log, split table, and conditions record. Organizing related links around the visitor’s next decision increases discovery without pretending that one race-time scenario answers every coaching question.
Before publishing or sharing a target, verify that the baseline time is complete, the improvement is applied to elapsed time, the race distance and course are recorded, the result is converted back to a readable clock, and the rounding rule is named. Create conservative, expected, and stretch scenarios when uncertainty matters. Keep prediction language separate from goal language.
Then decide what evidence will be checked next: a workout split, a controlled time trial, a new race, or recovery feedback. The calculator’s strongest output is not merely a faster timestamp. It is a transparent, testable scenario that a runner can understand, discuss, and revise when real-world evidence arrives.
The saved-time output tells you how much faster the complete event must be, but it does not say where those seconds should come from. Some athletes gain through pacing discipline, some through endurance, some through technique or conditions, and many through several small changes. Treat the saved seconds as a total budget to investigate rather than a demand for one dramatic workout.
For a 10 km target saving 145.75 seconds, an average comparison is about 14.575 seconds per kilometre, but that does not mean every kilometre must improve by exactly that amount. The race plan can distribute the time differently while still checking the total. This framing makes the target concrete without pretending the course is uniform.
An official race may include chip timing, a measured course, a crowded start, and a certified distance. A training run may use a watch, GPS smoothing, a pause, or a route that is slightly long or short. Both can be useful, but they should not be merged into one baseline without a note. If the measurement method changes, keep the labels visible.
When a training result is used as a readiness check, compare effort and conditions as well as the clock. A controlled workout can support confidence in a target without being an official performance. The calculator makes the target reproducible; the evidence record determines how much confidence to place in it.
Distance alone does not describe a course. Elevation gain, downhill sections, surface, turns, wind exposure, and aid-station layout can change the relationship between pace and finish time. Do not add an unverified course correction to the percentage formula and present it as fact. Record the course features and explain whether the output is a neutral clock scenario or a course-specific plan.
For a hilly event, average pace may be less useful than effort, split ranges, or segment goals. The race-time output can still define the total time to test, while a course plan allocates effort around the terrain. This division keeps the arithmetic clean and gives the practical decision the attention it needs.
Longer events can be limited by fueling, hydration, sleep, heat management, and recovery as much as by raw speed. The calculator does not estimate those needs and should not be used to prescribe intake. Add a separate plan based on the event, individual tolerance, weather, and qualified guidance where needed.
A target becomes more useful when the record includes the conditions under which it can be attempted: recent training consistency, recovery status, and a plan for the course. If those conditions are not met, change the scenario or postpone the test. Revising a target is a sign of good planning, not failure.
A compact target table can contain baseline label, event distance, current clock, improvement percentage, target clock, saved seconds, average target pace, course notes, and next evidence. Keep one row per scenario and one row for the achieved result when it becomes available. This format helps a coach or runner see the difference between arithmetic and interpretation.
Add a status such as planned, tested, achieved, or revised. Do not use color or a badge as a substitute for the actual time and conditions. A reader should be able to copy the baseline and percentage back into the calculator and reproduce the target without guessing which number was used.
Use a different method when the question is race equivalency across distances, a probability of qualifying, a physiological threshold, a medical return-to-sport decision, or a detailed pace forecast under weather conditions. Those questions need different evidence and assumptions. This calculator can provide a transparent time-reduction scenario, but it should not be stretched into a model it was not designed to be.
A good article says when to continue and when to stop. If the visitor only needs a target clock, this page is sufficient. If the visitor needs a training prescription or health decision, continue to a qualified coach, clinician, official event guidance, or a validated method and carry the documented baseline with them.
After the target is calculated, ask one actionable question: what will be measured next, and when? It might be a controlled split session, a recovery review, an official race, or a comparison under similar conditions. A target without a next measurement stays aspirational; a target with a checkpoint can teach the runner whether the assumption was useful.
Link the next action to the visitor’s intent and keep the language human. The goal is not to make a long article feel longer. It is to help a runner understand the clock, use the result responsibly, and return with better evidence for the next scenario.
Apply a chosen percentage improvement to a current race time and show the faster target, seconds saved, and equivalent minutes saved.
Target time = current time × (1 − improvement percentage ÷ 100); time saved = current time − target time. A percentage improvement in elapsed time is a planning scenario: the target is the current duration multiplied by the fraction that remains. The page keeps the saved seconds visible because the same percentage represents different absolute gains for different race durations.
Enter Current hours, Current minutes, Current seconds, Target improvement, then choose Calculate.
The entered time is a completed or planned duration greater than zero. Improvement is applied to elapsed time, not to speed or distance; a 5% faster time is not exactly the same as a 5% faster speed. The result is a target scenario and does not predict whether training, weather, course, equipment, or health will support it. Hours, minutes, and seconds are treated as one continuous duration after conversion to seconds. The displayed target time is rounded to hundredths for readability while the numeric saved-time outputs retain the calculation precision. Training load, pacing strategy, injury risk, and event rules require separate advice and are not inferred.
This calculator is part of the WorldCalculate library. Its formula, example, assumptions, input bounds, and output formatting follow the official methodology.
These WorldCalculate collections connect this tool with related questions while keeping each calculation separate and transparent.