
Goal
Calculate descriptive Shannon diversity and evenness from a bounded list of entered species or group counts.
Worldwide context
Saved once here, used across the site.
Currency changes display only. Country selection guides tax input; no tax rate is guessed.
Calculate descriptive Shannon diversity and evenness from a bounded list of entered species or group counts.
For total N, p_i = count_i/N and H = -sum(p_i ln p_i) over positive counts; evenness = H/ln(S), where S is the number of positive groups and evenness is 0 when S <= 1.A clearer path to an answer
This page keeps the calculation transparent: define the goal, enter the matching values, inspect the method, and decide what the result means in your situation.
Calculate descriptive Shannon diversity and evenness from a bounded list of entered species or group counts.
Species or group counts
For total N, p_i = count_i/N and H = -sum(p_i ln p_i) over positive counts; evenness = H/ln(S), where S is the number of positive groups and evenness is 0 when S <= 1.
Calculate, review the assumptions below, then compare a related tool when the decision needs more context.
Calculate descriptive Shannon diversity and evenness from a bounded list of entered species or group counts.
Open the Shannon Diversity Index pageMore science tools
Download PDFDownload Word (.doc)
Enter your values above and choose Calculate to see the result here.
Calculation map
For total N, p_i = count_i/N and H = -sum(p_i ln p_i) over positive counts; evenness = H/ln(S), where S is the number of positive groups and evenness is 0 when S <= 1.
Bounded, transparent calculation
Your recent runs stay in this browser session only.
Formula: For total N, p_i = count_i/N and H = -sum(p_i ln p_i) over positive counts; evenness = H/ln(S), where S is the number of positive groups and evenness is 0 when S <= 1.
This calculator summarizes an entered sample count list with total count, Shannon diversity in natural-log units, and Shannon evenness. It is a descriptive sample-diversity calculation only: it is not a biodiversity assessment, ecological diagnosis, conservation conclusion, site survey, or ecological advice.
Worked example: Total count 100; Shannon diversity about 1.279854 nats; Shannon evenness about 0.923220.
The displayed limits are checked before the handler runs. Model-specific domain checks may also reject impossible or non-finite inputs.
Methodology: This calculator follows the WorldCalculate input, formula, precision, and boundary policy. Read the official methodology.
Calculator usage statistics
This section counts anonymous successful Calculate submissions, not unique visitors. Counts and top tools appear only when trusted aggregate data is available; country analysis is shown only under the same condition and reporting threshold.
Answer-first guide
Calculate descriptive Shannon diversity and evenness from a bounded list of entered species or group counts. Start with one clearly defined goal, enter values in the units shown, and keep the result attached to the assumptions below.
This tool is useful when your question includes Shannon index, Shannon diversity, species counts. It returns the outputs declared in the calculator contract rather than a live quote, approval, diagnosis, or professional sign-off.
Species or group counts. Keep the same time period, unit system, and currency wherever the form requires comparable values.
Run the worked example first, compare its output with the page's example, then change one input at a time. This makes an unexpected result easier to trace to a unit, boundary, or assumption.
Need a wider view? Browse Science Calculators or compare the related tools below. The WorldCalculate methodology explains how formulas, examples, limits, and revisions are reviewed.
For total N, p_i = count_i/N and H = -sum(p_i ln p_i) over positive counts; evenness = H/ln(S), where S is the number of positive groups and evenness is 0 when S <= 1.
This calculator summarizes an entered sample count list with total count, Shannon diversity in natural-log units, and Shannon evenness. It is a descriptive sample-diversity calculation only: it is not a biodiversity assessment, ecological diagnosis, conservation conclusion, site survey, or ecological advice.
Total count 100; Shannon diversity about 1.279854 nats; Shannon evenness about 0.923220.
Context and background
Science calculators define a system, choose an equation, apply units and constants, and show the substitution. Effects outside that model remain outside the result.
Introductory science problem solving builds from measured quantities and idealized relationships. Those models are valuable for learning and first-pass estimates, while experiments and engineering decisions need additional evidence.
Research and review
Researched by Hassan ALRowaie, Founder and editorial researcher at WorldCalculate.
This guide follows the live calculator's declared inputs, formula, worked example, assumptions, validation boundaries, and source-backed methodology. The review date describes editorial review of the calculator explanation; it is not a promise that external facts or rates remain current.
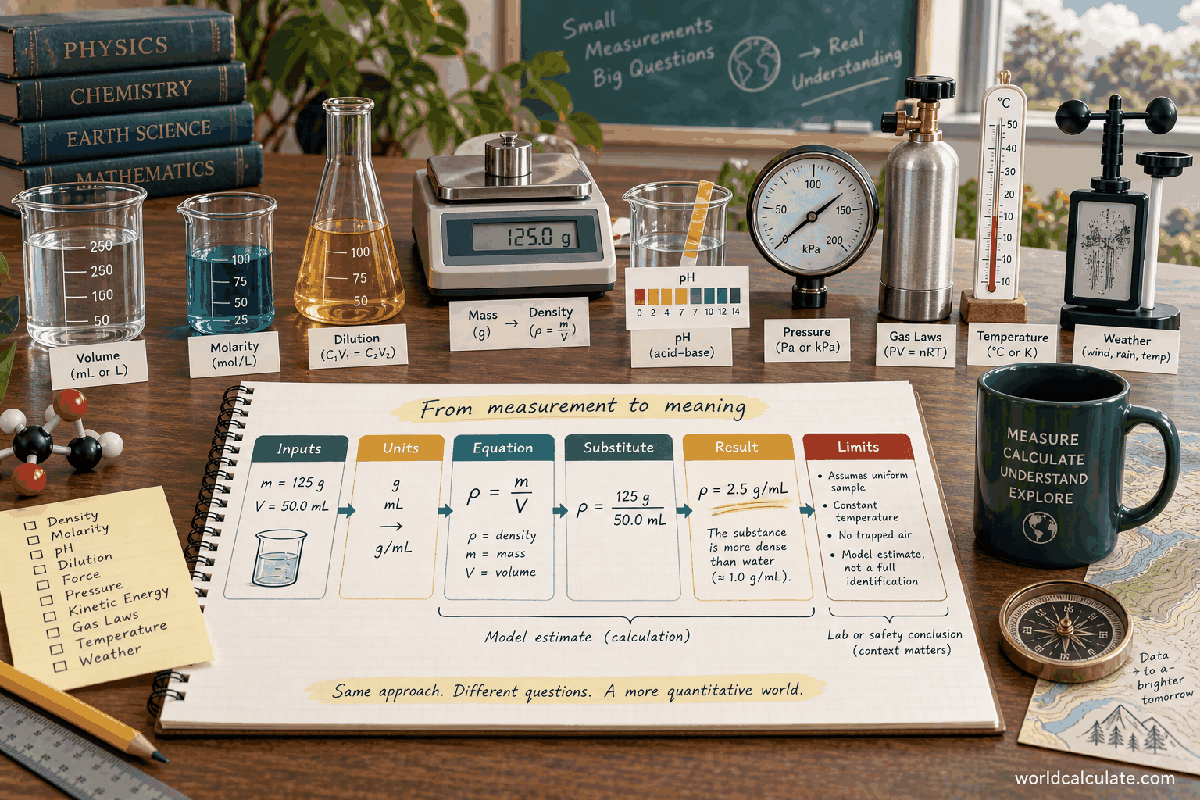
The Shannon index is a compact summary of how an entered sample is distributed across its listed groups. This calculator accepts a short text list of nonnegative species or group counts, converts each positive count into a proportion of the total, and applies natural logarithms. It reports the total count, Shannon diversity, and Shannon evenness. The calculation is deliberately descriptive. It does not decide whether a sample represents biodiversity, assess habitat condition, identify species, evaluate survey quality, or recommend ecological action. The sections below explain the list contract, the proportion step, the logarithmic formula, the role of zero counts, the evenness normalization, numerical limits, comparison choices, and the boundary between a transparent sample summary and a broader ecological assessment.
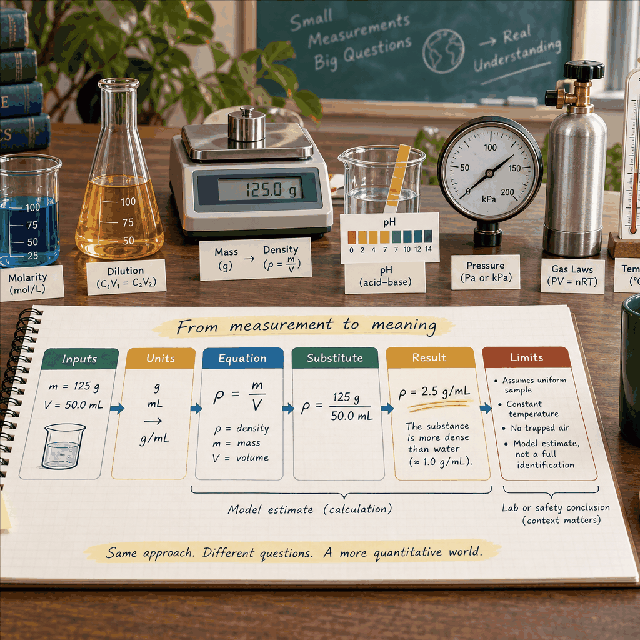
The result describes the distribution of the counts that the user enters. If several groups have similar positive counts, the distribution is relatively even. If most of the total is concentrated in one group, the distribution is less even. Shannon diversity combines those two ideas through the proportions of the total and the logarithms of those proportions. The word sample is important: the number summarizes the supplied list, not every organism, species, or group that might exist beyond the observed record.
A total count is returned beside the index so the calculation has a visible denominator. Two lists can have the same proportions and therefore the same Shannon values while having very different totals. Conversely, two samples with the same total can have different distributions and different index values. Keeping the total, the raw list, and the sampling description together prevents a compact index from being mistaken for a complete account of an ecological system.
The counts field is text because a list is more convenient to enter than a fixed set of fifty separate controls. A valid entry contains decimal tokens separated by commas, semicolons, whitespace, or a mixture of those separators. For example, a user can enter 10, 20; 30 40. Surrounding whitespace is ignored. The delimiters are separators only; the calculator does not interpret labels, species names, comments, ranges, or formulas inside the field.
The list is bounded at fifty values and two thousand text characters. These limits keep parsing and logarithmic work finite in a browser and make the contract easy to inspect. The character limit is not a claim that a scientific inventory should be this short. A larger inventory needs a data-management and validation process that preserves row identity, measurement units, sampling effort, and provenance. This page chooses a deliberately small worksheet-style boundary instead of pretending to be an inventory system.
Each token must be a complete decimal representation. Ordinary forms such as 12, 12.5,.5, and 1e3 are accepted when their numeric value remains within the declared range. A token is converted as one number; partial parsing is not used. That means a value with trailing letters, an unfinished exponent, a second decimal point, a hexadecimal prefix, or a nonnumeric word is rejected rather than truncated to a number that happens to appear at its beginning.
Separators also have a grammar. A comma or semicolon cannot appear at the beginning or end of the trimmed list, and two punctuation separators cannot be adjacent even when whitespace appears between them. Thus 1,,2 and 1;;2 are rejected. Repeated whitespace is harmless because whitespace itself is a valid delimiter. This distinction protects the meaning of a missing count: it is better to ask for correction than to silently remove an empty position from the sample record.
After validation, the handler adds every entered count to form N, the total count. A zero is a valid count and remains part of the entered list, but it contributes no amount to N and no logarithmic term. The number S of positive groups is the number of entries strictly greater than zero. A list containing 0, 5, and 0 therefore has total 5 and S equal to 1. A list containing only zeros is rejected because it cannot form proportions with a positive total.
The counts need not be whole numbers in this calculator. Decimal values can represent an already normalized estimate, a weighted observation, or a deliberately simplified exercise, provided the user understands what the numbers mean. The engine does not claim that a decimal count is a literal organism tally. If a study requires integer individuals, sampling weights, detection corrections, or replicate structure, those choices must be made before entering the list and documented beside it.
For each positive count c_i, the proportion is p_i = c_i divided by N. Because N includes all counts and no count is negative, each positive proportion is greater than zero and the proportions over positive groups sum to one apart from ordinary floating-point rounding. A zero count would have p equal to zero, but its term is omitted rather than sending zero into a logarithm. The handler uses the validated values directly and does not add a pseudocount or continuity correction.
The denominator makes the index scale independent of the absolute sample size when the composition is unchanged. Lists 1, 2, 3 and 10, 20, 30 have identical proportions and therefore identical diversity and evenness, while their totals differ. That property is useful for comparing composition summaries, but it does not make samples automatically comparable. Sampling effort, detection probability, group definition, and time or location can still change what the same proportions mean.
The diversity result is H = -sum(p_i ln p_i) over positive groups. The natural logarithm is used, so the numerical unit is commonly called a nat. For a proportion between zero and one, ln(p_i) is nonpositive, and the negative sign makes each contribution nonnegative. A group contributes more when it has a substantial share of the sample, while a very small positive share contributes a smaller amount. The final H is the sum of those group contributions.
The formula should be read as a model of the entered distribution, not as a hidden ecological mechanism. It does not estimate immigration, extinction, competition, resilience, or ecosystem function. It also does not require the calculator to know what the group labels mean. The same arithmetic can summarize categories in a classroom table or categories from a field observation, but the interpretation of those categories comes from the sampling design and not from the index alone.
Evenness compares the observed Shannon value with the largest value possible for the number of positive groups in this simple normalization. The calculator uses J = H / ln(S), where S is the count of positive groups. When all S positive proportions are equal, H equals ln(S), so J equals one. A concentrated distribution has a lower H relative to that same group count and therefore a lower evenness ratio.
There is no useful denominator when S is one because ln(1) is zero. The contract therefore returns evenness zero whenever there is at most one positive group. This is an explicit boundary, not an attempt to imply that a one-group sample has a negative or undefined ecological quality. The result simply follows the page's chosen display rule. Users who need another convention should state it and use a separately reviewed calculation.
Enter 1, 1; 1 1. The total is N = 4, there are S = 4 positive groups, and every proportion is 1/4. Each logarithmic contribution is -(1/4) ln(1/4). Adding four equal contributions gives H = ln(4), approximately 1.38629436112 nats. The evenness is H divided by ln(4), which is one in exact arithmetic and is returned as 1 by the numeric calculation. The mixed delimiters demonstrate that commas, semicolons, and spaces can be used in one valid entry.
The example is a mathematical calibration case. It does not say that the four groups are equally detectable, equally important, or equally represented in a larger population. It only tests the expected behavior of a uniform four-part list. A good worksheet can retain this kind of calibration alongside the actual sample so that a later reader knows whether a surprising result comes from the formula or from the data definition.
Enter 10, 20, 30, and 40. The total is 100 and the proportions are 0.1, 0.2, 0.3, and 0.4. Substituting those values gives H approximately 1.27985422583 nats. Since S is four, the evenness is approximately 1.27985422583 divided by ln(4), or 0.92321967234. The index is lower than the equal-four-group calibration because the proportions are not equal, and the evenness makes that comparison relative to the same number of positive groups.
The difference between 1.386294 and 1.279854 is a property of these two distributions, not a universal threshold. Whether a difference matters depends on the purpose of the sample, the measurement uncertainty, the group definitions, and the sampling process. The calculator does not provide a significance test, confidence interval, reference benchmark, or decision rule. It makes the arithmetic reproducible so those additional questions can be considered separately.
A list such as 0, 5, 0 is valid because the positive count supplies a positive total. The only positive proportion is one, so H is mathematically zero and S is one. The calculator returns total 5, diversity zero, and evenness zero. This output should not be read as a statement that an ecological system has no diversity. It says only that the entered sample record contains one positive category after the zeros are considered.
A list such as 5, 5, 0, 0 has two positive groups with equal proportions. Its diversity is ln(2), and its evenness is one because the positive groups are equal. The zero entries do not reduce evenness by being listed; they are not positive groups under this contract. If zero means an unobserved group rather than a measured absence, the sampling interpretation may be different. The engine cannot tell those meanings apart, so the record should state how zeros were produced.
Every parsed count must be between zero and 1,000,000,000 and must be finite. The total of at most fifty such values is comfortably within the finite JavaScript number range, but the handler still checks the sum and each displayed result. A nonfinite token such as an overflowing exponent, an infinity word, or a value supplied through a direct call is rejected. The form hint is not the enforcement layer; the pure handler repeats the contract for every caller.
The character cap and value cap also protect the work done before arithmetic. The parser checks length before splitting, rejects malformed punctuation before mapping tokens, and checks list length before calculating. It does not evaluate expressions or execute input as code. Values outside the range are rejected rather than clipped to an endpoint, because clipping would change the sample and hide the correction that the user needs to make.
The engine returns JavaScript numbers and guards them for finiteness. Display precision is a presentation choice stored on each result entry; it does not change the internal formula. A value such as H = 1.27985422583 may be shown to fewer decimal places while the underlying result remains available to the caller. When comparing values, use a consistent rounding rule and retain the raw list so a displayed difference is not confused with a mathematical discontinuity.
Floating-point arithmetic can produce a tiny residue around an exact boundary. The handler normalizes negative zero to zero and applies the evenness rule explicitly for one or fewer positive groups. It does not round proportions before taking logarithms, because early rounding would alter the sum and the index. If a result appears outside an expected conceptual range, first inspect the input, the group definition, and the log convention before treating the numeric engine as an ecological conclusion.
A Shannon value can be compared with another value only when the lists describe compatible categories and sampling rules. The same names or positions in a list are not enough. Check whether the samples use the same observation period, effort, detection method, inclusion rule, and treatment of zeros. If one list merges several groups and another separates them, the number of positive groups and the proportions answer different questions even if both use the same formula.
Evenness can help separate the effect of group count from the effect of concentration, but it does not solve the comparison problem by itself. A sample with many rare groups may have a different index from a sample with fewer well-observed groups because of sampling effort rather than an underlying system change. The calculator returns no p-value and makes no claim that one sample is better, healthier, or more valuable. It supplies comparable arithmetic after the comparison design has been aligned.
A descriptive count summary is not a biodiversity assessment. Biodiversity can involve composition, rarity, genetic variation, functional roles, spatial scale, temporal change, habitat context, and the quality of the observation process. None of those dimensions is supplied to this handler. A high index is not automatically evidence of a healthy site, and a low index is not automatically evidence of damage, poor management, or ecological risk.
The page also does not identify organisms, verify taxonomy, infer missing species, assess conservation status, evaluate environmental impact, or choose a field intervention. It does not provide ecological advice. If a decision concerns habitat, restoration, monitoring design, protected status, or public policy, use qualified domain review and evidence appropriate to that decision. The number can be one transparent descriptive input, but it cannot carry those conclusions on its own.
Start a report by preserving the raw count list exactly as entered and naming what each position represents. Record the sample boundary, date or interval, collection method, effort, treatment of zeros, and any weighting or preprocessing performed before entry. Then record the total, the positive-group count, the logarithm convention, the diversity value, and the evenness rule. This makes it possible for another reader to reconstruct the proportions rather than receiving only an unexplained index.
Before using the result in a comparison, run a calibration list such as equal positive counts and check that its evenness is one. Then inspect the actual list for malformed separators, unintended zeros, duplicated categories, and unit or scaling mistakes. Finally, attach the scope statement: the output is a descriptive summary of the entered sample, not a biodiversity assessment or ecological advice. That sentence keeps a useful arithmetic result from being promoted into a conclusion it cannot support.
The index can fit into a larger analysis when its role remains explicit. An analyst might place it beside total observations, sampling effort, environmental measurements, or a separate uncertainty analysis. In that setting, the calculator contributes a deterministic transformation of the count list. It does not supply the other variables, select a statistical design, or decide whether the transformed value should be used as a response, predictor, screening value, or descriptive caption.
The strongest practice is to keep raw and derived data together. Store the count list, the total, the positive-group count, the exact software or formula version, and any preprocessing note. If a later analyst changes category boundaries or handles zeros differently, they can recompute and explain the change. Treating the formula as one documented step preserves both usefulness and restraint: the output is easy to audit because the input and operation are visible, and its interpretation remains tied to the sample that produced it.
Calculate descriptive Shannon diversity and evenness from a bounded list of entered species or group counts.
For total N, p_i = count_i/N and H = -sum(p_i ln p_i) over positive counts; evenness = H/ln(S), where S is the number of positive groups and evenness is 0 when S <= 1. This calculator summarizes an entered sample count list with total count, Shannon diversity in natural-log units, and Shannon evenness. It is a descriptive sample-diversity calculation only: it is not a biodiversity assessment, ecological diagnosis, conservation conclusion, site survey, or ecological advice.
Enter Species or group counts, then choose Calculate.
Each value is a finite nonnegative decimal count for one entered species or group, and the list has no more than 50 values. The positive counts are treated as one comparable sample, proportions are formed from their total, and zero-count groups contribute no logarithmic term. Natural logarithms define H in nats; the result describes the supplied sample record and does not infer habitat condition, species identity, sampling quality, or ecological action.
This calculator is part of the WorldCalculate library. Its formula, example, assumptions, input bounds, and output formatting follow the official methodology.
These WorldCalculate collections connect this tool with related questions while keeping each calculation separate and transparent.