
Goal
Compare measured pollutant concentrations before and after a COVID-era intervention period and calculate percentage change and concentration-time differences without making a health claim.
Worldwide context
Saved once here, used across the site.
Currency changes display only. Country selection guides tax input; no tax rate is guessed.
Compare measured pollutant concentrations before and after a COVID-era intervention period and calculate percentage change and concentration-time differences without making a health claim.
Absolute change = after concentration − before concentration; percentage change = absolute change ÷ before concentration × 100; concentration-time per person = concentration × hours per day × days; population concentration-time change = per-person change × population.A clearer path to an answer
This page keeps the calculation transparent: define the goal, enter the matching values, inspect the method, and decide what the result means in your situation.
Compare measured pollutant concentrations before and after a COVID-era intervention period and calculate percentage change and concentration-time differences without making a health claim.
Before-period concentration · After-period concentration · Comparison exposure window per day · Number of comparison days · Population represented
Absolute change = after concentration − before concentration; percentage change = absolute change ÷ before concentration × 100; concentration-time per person = concentration × hours per day × days; population concentration-time change = per-person change × population.
Calculate, review the assumptions below, then compare a related tool when the decision needs more context.
Compare measured pollutant concentrations before and after a COVID-era intervention period and calculate percentage change and concentration-time differences without making a health claim.
Open the COVID-Era Before-and-After Pollution Calculator pageMore ecology tools
Download PDFDownload Word (.doc)
Enter your values above and choose Calculate to see the result here.
Calculation map
Absolute change = after concentration − before concentration; percentage change = absolute change ÷ before concentration × 100; concentration-time per person = concentration × hours per day × days; population concentration-time change = per-person change × population.
Bounded, transparent calculation
Your recent runs stay in this browser session only.
Formula: Absolute change = after concentration − before concentration; percentage change = absolute change ÷ before concentration × 100; concentration-time per person = concentration × hours per day × days; population concentration-time change = per-person change × population.
Historical COVID-era studies compared pollutant measurements across before, during, and after intervention periods, but a simple comparison cannot isolate weather, season, transport, or health effects. This page calculates the descriptive arithmetic only: absolute and percentage concentration change plus a concentration-time comparison for a defined window and population.
Worked example: The concentration change is −20 units or −40%; the per-person before-minus-after concentration-time difference is 4,800 concentration-hours and the population difference is 480,000,000 population concentration-hours.
The displayed limits are checked before the handler runs. Model-specific domain checks may also reject impossible or non-finite inputs.
Methodology: This calculator follows the WorldCalculate input, formula, precision, and boundary policy. Read the official methodology.
Calculator usage statistics
This section counts anonymous successful Calculate submissions, not unique visitors. Counts and top tools appear only when trusted aggregate data is available; country analysis is shown only under the same condition and reporting threshold.
Answer-first guide
Compare measured pollutant concentrations before and after a COVID-era intervention period and calculate percentage change and concentration-time differences without making a health claim. Start with one clearly defined goal, enter values in the units shown, and keep the result attached to the assumptions below.
This tool is useful when your question includes COVID pollution calculator, before after air pollution, lockdown pollution change. It returns the outputs declared in the calculator contract rather than a live quote, approval, diagnosis, or professional sign-off.
Before-period concentration · After-period concentration · Comparison exposure window per day · Number of comparison days · Population represented. Keep the same time period, unit system, and currency wherever the form requires comparable values.
Run the worked example first, compare its output with the page's example, then change one input at a time. This makes an unexpected result easier to trace to a unit, boundary, or assumption.
Need a wider view? Browse Ecology & Sustainability Calculators or compare the related tools below. The WorldCalculate methodology explains how formulas, examples, limits, and revisions are reviewed.
Absolute change = after concentration − before concentration; percentage change = absolute change ÷ before concentration × 100; concentration-time per person = concentration × hours per day × days; population concentration-time change = per-person change × population.
Historical COVID-era studies compared pollutant measurements across before, during, and after intervention periods, but a simple comparison cannot isolate weather, season, transport, or health effects. This page calculates the descriptive arithmetic only: absolute and percentage concentration change plus a concentration-time comparison for a defined window and population.
The concentration change is −20 units or −40%; the per-person before-minus-after concentration-time difference is 4,800 concentration-hours and the population difference is 480,000,000 population concentration-hours.
Context and background
Ecology and sustainability scenarios depend on geography, technology, lifecycle boundary, season, measurement method, and the factor supplied by the visitor.
Environmental analysis became more actionable as systems were described by flows, stocks, boundaries, and time periods. A transparent scenario is more useful than a universal-looking number with hidden assumptions.
Research and review
Researched by Hassan ALRowaie, Founder and editorial researcher at WorldCalculate.
This guide follows the live calculator's declared inputs, formula, worked example, assumptions, validation boundaries, and source-backed methodology. The review date describes editorial review of the calculator explanation; it is not a promise that external facts or rates remain current.
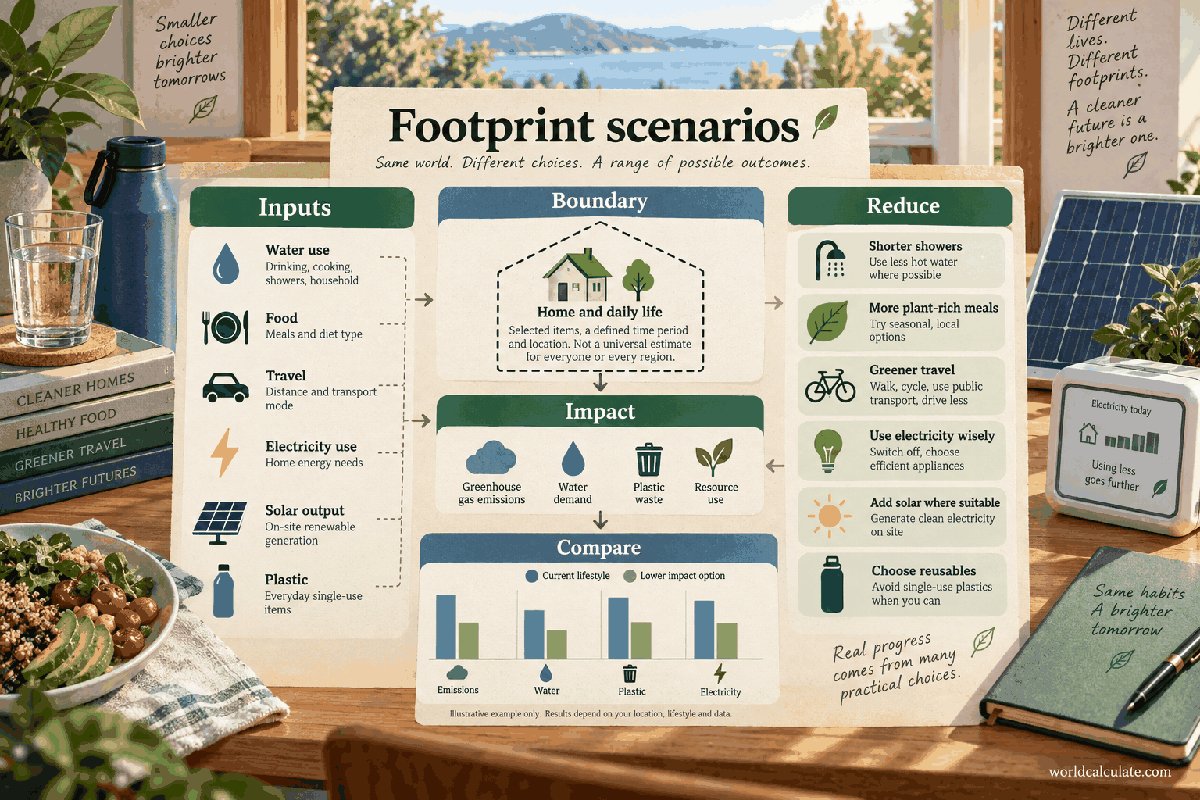
COVID-era air-quality studies created many before-and-after questions: did a pollutant concentration fall, by how much, and for what period? The arithmetic is straightforward, but the interpretation is not. This page keeps the calculation descriptive and asks the user to match pollutant, unit, location, averaging period, and exposure window before comparing the two values.
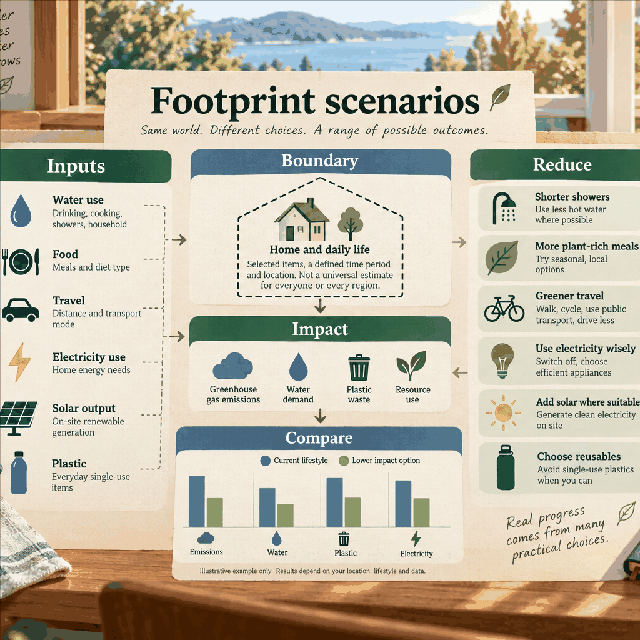
The calculator compares two concentration values. The absolute change is after minus before, so a negative result means the after value is lower. The percentage change divides that difference by the before value. This sign convention makes the result easy to reproduce and avoids hiding whether a decrease or increase occurred.
The page then multiplies each concentration by a selected number of hours per day and days. That produces a concentration-time quantity for a defined scenario. It is a comparison unit, not a measured inhaled dose, because breathing rate, indoor exposure, filtration, and time away from the location are not modeled.
A before period and an after period should use comparable averaging rules. A daily mean should not be compared casually with a one-hour peak. The same pollutant name can also hide different instruments, size fractions, calibration rules, or detection-limit treatments. Put those details beside the result.
COVID-era studies often separated pre-intervention, intervention, and post-intervention windows. Reproducing a published number requires the study’s dates, stations, quality controls, and statistical method, not just two values copied from a chart. This calculator handles the arithmetic after those study-design decisions have been made.
The absolute change retains the input concentration unit. If a pollutant falls from 50 to 30 units, the change is minus 20 units. The percentage change is minus 40% because 20 is 40% of the before value. Both outputs are useful: the absolute difference shows the measurement scale, while the percentage gives a normalized comparison.
A percentage can look dramatic when the before value is small, and a modest percentage can represent a large absolute change when the starting value is high. Report both whenever possible. Never remove the units from the absolute result or the denominator from the percentage explanation.
Multiplying concentration by hours per day and days creates a simple exposure-window comparison. If 50 units are assigned to eight hours per day for 30 days, the before value is 12,000 concentration-hours per person. A 30-unit after value gives 7,200, and the difference is 4,800.
This quantity is useful for teaching and scenario bookkeeping, but it is not a dose. A person’s inhaled mass also depends on ventilation rate, time spent indoors and outdoors, microenvironment, and pollutant behavior. The tool intentionally labels the result concentration-time rather than presenting it as a health metric.
The population input multiplies the per-person concentration-time difference. It can represent a scenario for a defined population, but it does not prove that every person experienced the same concentration or exposure window. If monitor coverage is uneven, the population result is a model assumption and should be labeled accordingly.
Population multiplication is often useful for comparing the scale of a monitoring scenario, yet it should not be turned into avoided illness or deaths. Health impact analysis requires epidemiological concentration-response functions, population characteristics, baseline rates, uncertainty, and causal design that are outside this page.
Air pollutant concentrations change with wind, rain, temperature, atmospheric chemistry, season, emissions, and monitoring location. A reduction during a period of restricted activity may be associated with less traffic or industry, but a simple before-and-after subtraction cannot isolate those influences.
If the question is causal, use a study design that controls for relevant confounders, such as a time-series model, matched comparison, or other method appropriate to the data. This page can help verify the descriptive numbers reported by that study, but it should not be used to manufacture a causal conclusion from two averages.
Record the pollutant, units, station or geographic area, averaging period, dates, and source for both values. Confirm that the before denominator is positive. Enter the comparison window and population only after defining what they represent. Then check the sign of the change and independently recompute the percentage.
For several stations or pollutants, run a row for each comparable pair and preserve the original data table. A single aggregate can hide a mixture of increases and decreases. The calculator’s best role is a readable check inside a documented workflow, not a replacement for the data-quality record.
A careful sentence says that the measured concentration changed by a stated amount between two defined periods. It gives the pollutant and unit, identifies the location and dates, and notes whether the comparison is descriptive. It does not say the change was caused by COVID-19 or that it produced a specific health benefit.
This distinction matters because historical pollution changes were not identical everywhere and pollutants can respond differently. Some traffic-related pollutants fell while secondary pollutants or weather-sensitive measures behaved differently. Reporting the exact comparison, uncertainty, and design limitations keeps the result useful and credible.
Compare measured pollutant concentrations before and after a COVID-era intervention period and calculate percentage change and concentration-time differences without making a health claim.
Absolute change = after concentration − before concentration; percentage change = absolute change ÷ before concentration × 100; concentration-time per person = concentration × hours per day × days; population concentration-time change = per-person change × population. Historical COVID-era studies compared pollutant measurements across before, during, and after intervention periods, but a simple comparison cannot isolate weather, season, transport, or health effects. This page calculates the descriptive arithmetic only: absolute and percentage concentration change plus a concentration-time comparison for a defined window and population.
Enter Before-period concentration, After-period concentration, Comparison exposure window per day, Number of comparison days, Population represented, then choose Calculate.
Before and after values describe the same pollutant, unit, averaging period, location, and measurement basis. The exposure window is a bookkeeping duration and does not estimate personal inhalation dose or absorbed dose. The population value is a scenario multiplier, not evidence that every person experienced the same concentration. A percentage change uses the before concentration as its denominator and requires it to be positive. No causal effect is attributed to COVID-19, lockdowns, policy, weather, or traffic by this calculator. The output is descriptive environmental arithmetic and not a health-risk, mortality, or epidemiological estimate.
This calculator is part of the WorldCalculate library. Its formula, example, assumptions, input bounds, and output formatting follow the official methodology.
These WorldCalculate collections connect this tool with related questions while keeping each calculation separate and transparent.