
Goal
Estimate y at an in-range x between two ordered points using a straight-line interpolation fraction.
Worldwide context
Saved once here, used across the site.
Currency changes display only. Country selection guides tax input; no tax rate is guessed.
Estimate y at an in-range x between two ordered points using a straight-line interpolation fraction.
t = (x - x0)/(x1 - x0); y = (1 - t)y0 + ty1, for x0 < x1 and x0 <= x <= x1.A clearer path to an answer
This page keeps the calculation transparent: define the goal, enter the matching values, inspect the method, and decide what the result means in your situation.
Estimate y at an in-range x between two ordered points using a straight-line interpolation fraction.
First x0 · Second x1 · First y0 · Second y1 · Target x
t = (x - x0)/(x1 - x0); y = (1 - t)y0 + ty1, for x0 < x1 and x0 <= x <= x1.
Calculate, review the assumptions below, then compare a related tool when the decision needs more context.
Estimate y at an in-range x between two ordered points using a straight-line interpolation fraction.
Open the Linear Interpolation pageMore math tools
Download PDFDownload Word (.doc)
Enter your values above and choose Calculate to see the result here.
Calculation map
t = (x - x0)/(x1 - x0); y = (1 - t)y0 + ty1, for x0 < x1 and x0 <= x <= x1.
Bounded, transparent calculation
Your recent runs stay in this browser session only.
Formula: t = (x - x0)/(x1 - x0); y = (1 - t)y0 + ty1, for x0 < x1 and x0 <= x <= x1.
Linear interpolation uses the fraction of the horizontal interval reached by x and applies the same fraction between y0 and y1. Reversed or equal endpoints and out-of-range targets are rejected.
Worked example: t = 0.25 and the interpolated y is 25.
The displayed limits are checked before the handler runs. Model-specific domain checks may also reject impossible or non-finite inputs.
Methodology: This calculator follows the WorldCalculate input, formula, precision, and boundary policy. Read the official methodology.
Calculator usage statistics
This section counts anonymous successful Calculate submissions, not unique visitors. Counts and top tools appear only when trusted aggregate data is available; country analysis is shown only under the same condition and reporting threshold.
Answer-first guide
Estimate y at an in-range x between two ordered points using a straight-line interpolation fraction. Start with one clearly defined goal, enter values in the units shown, and keep the result attached to the assumptions below.
This tool is useful when your question includes linear interpolation, lerp, interpolate between points. It returns the outputs declared in the calculator contract rather than a live quote, approval, diagnosis, or professional sign-off.
First x0 · Second x1 · First y0 · Second y1 · Target x. Keep the same time period, unit system, and currency wherever the form requires comparable values.
Run the worked example first, compare its output with the page's example, then change one input at a time. This makes an unexpected result easier to trace to a unit, boundary, or assumption.
Need a wider view? Browse Math Calculators or compare the related tools below. The WorldCalculate methodology explains how formulas, examples, limits, and revisions are reviewed.
t = (x - x0)/(x1 - x0); y = (1 - t)y0 + ty1, for x0 < x1 and x0 <= x <= x1.
Linear interpolation uses the fraction of the horizontal interval reached by x and applies the same fraction between y0 and y1. Reversed or equal endpoints and out-of-range targets are rejected.
t = 0.25 and the interpolated y is 25.
Context and background
Math calculators move from named quantities to a relation, then to a result that can be checked with substitution, units, or an alternate form.
Arithmetic, algebra, geometry, trigonometry, and number theory provide reusable structures for classroom work and everyday reasoning. Each page narrows that structure to one declared problem.
Research and review
Researched by Hassan ALRowaie, Founder and editorial researcher at WorldCalculate.
This guide follows the live calculator's declared inputs, formula, worked example, assumptions, validation boundaries, and source-backed methodology. The review date describes editorial review of the calculator explanation; it is not a promise that external facts or rates remain current.

Linear interpolation estimates a value between two known ordered points by assuming a straight-line relationship between them. This calculator accepts x0, x1, y0, y1, and a target x. It requires x0 to be strictly less than x1 and the target x to lie in the closed interval from x0 through x1. The engine computes t = (x - x0)/(x1 - x0), then returns y = (1 - t)y0 + ty1. The page rejects reversed or equal endpoints and refuses extrapolation outside the interval. This guide explains the field order, fraction, endpoint and interior examples, validation, interpretation, common errors, model limits, privacy and safety boundaries, and frequently asked questions.
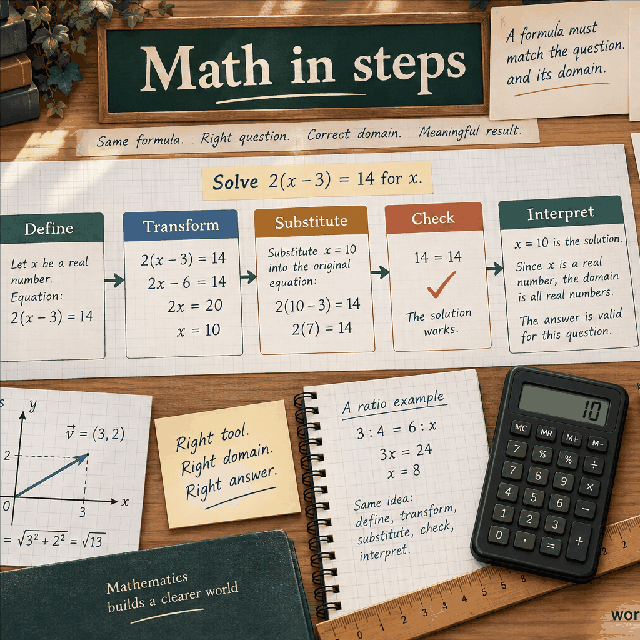
The calculator answers a local between-points question. Given the pair (x0, y0) and the pair (x1, y1), it estimates the y value at an x that is between the two x coordinates. The straight-line assumption means the change in y is spread at a constant rate over the interval. The result is a single interpolated y value, while the returned steps also show the fraction t used to reach it.
Interpolation is not the same as prediction from a fitted data model. The page uses exactly two endpoint pairs and does not inspect additional observations, calculate a regression, or choose a curve. A straight segment may be a useful local approximation, but it may not describe a nonlinear process between the endpoints. The formula is transparent so the reader can decide whether that assumption is suitable.
The target is constrained to the interval rather than allowed outside it. This is a deliberate contract: interpolation stays between known endpoints, while extrapolation assumes the same trend continues beyond known data and can be much less reliable. The handler reports an error instead of silently changing the question to extrapolation.
Enter the first x coordinate as x0 and its paired value as y0. Enter the second x coordinate as x1 and its paired value as y1. Then enter the target x. Pairing matters: y0 belongs to x0 and y1 belongs to x1. The form labels the endpoint roles rather than asking for an unordered list, making the relationship explicit.
All five values must be finite and between negative 1,000,000 and positive 1,000,000. Decimal inputs are valid. The endpoint ordering is stricter than the numeric bound: x0 must be less than x1, not merely different. The target includes both endpoints, so x equal to x0 or x1 is valid and produces an exact endpoint value under the formula.
The x and y values should share a coherent context for the slope-like relationship. The page does not convert units, sort timestamps, account for missing observations, or know whether x is time, distance, temperature, or another quantity. Prepare the paired data and units before entry.
The fraction t = (x - x0)/(x1 - x0) measures how far the target has traveled from the first x endpoint as a fraction of the full x interval. Because x0 < x1 and x is in the closed interval, t lies from zero through one in exact arithmetic. The value 0 means the first endpoint; 1 means the second endpoint; a middle value means a proportional position between them.
The y result is y = (1 - t)y0 + ty1. This is a weighted average of the endpoint values, with weights that add to one. Equivalently, y = y0 + t(y1 - y0). The weighted form makes endpoint contributions clear, while the difference form makes the change from y0 clear. The handler uses the weighted expression named in the catalog contract.
If y0 and y1 are equal, every in-range target returns that same constant y. If y1 is larger, an in-range result lies between the two y values; if y1 is smaller, the result moves downward. The x ordering does not require y ordering.
With x0 = 0, x1 = 10, y0 = 20, y1 = 40, and x = 2.5, t = (2.5 - 0)/(10 - 0) = 0.25. The result is 0.75 x 20 + 0.25 x 40 = 15 + 10 = 25. The target is one quarter of the horizontal way across, so the y value is one quarter of the vertical change above 20.
At x = x0 = 0, t is zero and y = 1 x 20 + 0 x 40 = 20. At x = x1 = 10, t is one and y = 0 x 20 + 1 x 40 = 40. These endpoint tests are important because they verify both pairing and the closed-interval rule. They also demonstrate that interpolation reproduces the supplied known values at its boundaries.
For a descending example, use x0 = -2, x1 = 2, y0 = 10, y1 = -6, and x = 1. The fraction is 3/4 and the result is 1/4 x 10 + 3/4 x -6 = 2.5 - 4.5 = -2. The y result can cross zero even though the x interval is ordered and valid.
Equal endpoints x0 = x1 are rejected because the denominator x1 - x0 is zero. There is no unique fraction for a vertical pair in this one-dimensional x-to-y contract. The page does not choose a midpoint, average the y values, or infer a separate vertical interpolation rule. A clear error keeps the undefined denominator visible.
Reversed endpoints x0 > x1 are also rejected even though a formula could produce a fraction for some targets. The contract uses ordered endpoints and a closed interval from lower x0 to higher x1. Requiring that order avoids ambiguous boundary language and catches accidentally swapped endpoint data. Swap the complete pairs outside the form if the source is in reverse order.
A target below x0 or above x1 is rejected. This protects the distinction between interpolation and extrapolation. A target exactly equal to either endpoint is accepted, as are values arbitrarily close to an endpoint when finite and bounded. The handler applies these relational checks after validating the individual numbers.
The result is the value implied by a straight segment between the supplied endpoints. It is not a guarantee that an observed process actually follows that segment. If the endpoints are measurements, their uncertainty is not propagated. If they are prices, rates, temperatures, or times, the page does not know whether the quantity changes smoothly or has a threshold between the observations.
The interpolation fraction t is often as informative as y. A result close to t = 0 relies mostly on the first endpoint, while a result close to t = 1 relies mostly on the second. At t = 0.5, both endpoints receive equal weight. Keeping t visible helps a reviewer understand where the target lies instead of reading the y value as an unsupported standalone observation.
A result within the numeric y range is a consequence of the weighted formula when t is in [0,1], not evidence that the model is accurate. A nonlinear curve can lie above or below its chord. Use additional observations or a suitable model when curvature, discontinuities, thresholds, or uncertainty matter.
Typical errors include pairing x0 with y1, using x1 - x instead of x - x0, dividing by an absolute interval while leaving the endpoints reversed, and applying an out-of-range target as if it were interpolation. Another error is treating t as a percentage without converting its fraction correctly. Write the endpoint pairs and the interval direction before substituting.
Check the endpoints first, then check the midpoint. At x = x0 the output should be y0; at x = x1 it should be y1; at the midpoint (x0 + x1)/2 it should be (y0 + y1)/2. Swapping both complete pairs after reordering should leave the geometric line unchanged, although the page's ordered contract expects the lower x to be named x0.
For source data, compare the result with any known intermediate observation rather than assuming agreement. If it differs materially, inspect whether the relation is curved, whether units or timestamps are misaligned, or whether an endpoint was copied incorrectly. The calculator can test arithmetic, not data quality.
This is a two-point, one-dimensional, bounded interpolation. It does not perform spline interpolation, regression, time-series forecasting, uncertainty propagation, multidimensional interpolation, or unit conversion. It also does not detect discontinuities or choose a better model from data. Those omissions are intentional because the result should remain traceable to the five visible inputs.
The inputs may represent private measurements, financial values, sensor readings, or business data. Enter only the values necessary for the formula and avoid names, account numbers, credentials, or raw datasets in any surrounding note. If the endpoints themselves are confidential, handle the result and shared screenshot according to the source data's sensitivity.
Do not use the interpolated number as a safety threshold, medical estimate, compliance value, or operational control without domain review. A straight-line estimate can be useful for education and simple planning, but high-consequence uses require a validated model, current measurements, uncertainty, and qualified oversight.
Why reject extrapolation? The formula can be evaluated outside the interval, but that would assume the endpoint trend continues where no known endpoint supports it. This page is contracted as interpolation, so it rejects targets outside the closed interval and keeps the assumption narrow. A separate tool could define extrapolation explicitly with its own limits.
What happens when y0 equals y1? Every valid in-range target receives that same y value because both weighted terms combine to the constant endpoint value. Equal y endpoints do not make the calculator invalid; only the x denominator and target-domain rules determine the structural validity.
Can x0 and x1 be negative? Yes. The only required ordering is x0 < x1, and both values must remain within the finite bound. The fraction still measures progress from the lower endpoint to the upper endpoint. Negative coordinates do not change the interpolation formula.
A useful interpolation record keeps the endpoint pairs, the target, the fraction t, and the returned y together. The fraction explains the weighting even when the y result is rounded. It also allows a reviewer to reproduce the result without guessing whether the target was measured from x0 or x1. For a report, keep the original data precision and the display precision separate so a readable label does not become a false claim about accuracy.
Endpoint identities are stronger than a single worked example. At x0 the formula must return y0, and at x1 it must return y1. At the midpoint it must return the average of y0 and y1. If y0 and y1 are equal, every in-range target must return that constant. These checks exercise the fraction, weights, endpoint pairing, and the closed target interval with simple expected values.
The straight-line assumption can be viewed as a constant slope between the endpoint pairs. The slope is (y1 - y0)/(x1 - x0), and the result is y0 plus that slope times x - x0. This alternate form is mathematically equivalent to the weighted formula. Comparing both forms by hand or in an independent script is useful when a result is surprising, while the catalog formula keeps the endpoint weights explicit for the user.
The page intentionally refuses equal x endpoints. A vertical pair does not define a single-valued y as a function of x, and the denominator would be zero. It also refuses reversed endpoint names and targets outside the closed interval. Those choices do not say that every interpolation library must use the same policy; they state a narrow and testable contract for this calculator. Reorder complete source pairs before entry when necessary.
A result between y0 and y1 is guaranteed by the weighted formula when the target is in range, but that does not guarantee the underlying phenomenon is linear. A curve can rise above or fall below its chord, and a discontinuity can occur between two otherwise valid measurements. If additional observations exist, compare them with the estimate. If curvature or uncertainty matters, choose a model that states those features instead of treating this page as a universal predictor.
Units deserve special attention because interpolation mixes a fraction with a y difference. The x coordinates need an ordered scale on which subtraction and division are meaningful, and y0 and y1 need a compatible output quantity. The form does not convert hours to seconds, sort timestamps, correct calibration, or account for a nonlinear unit scale. Prepare the paired values in a coherent representation before calculating.
For software use, validate the returned value and preserve the error branch for invalid domains. Do not catch an out-of-range target and silently extrapolate, and do not replace a zero denominator with a fallback average. A clear failure is safer than a plausible number answering a different question. The bounded finite output can then be passed to a renderer or later calculation without hiding whether the input contract was met.
A final review should state whether the result is an educational construction, a local estimate, or part of a larger validated data process. Include the source timestamps or endpoint meanings when they affect interpretation, but avoid placing private identifiers into the calculator or a shared screenshot. The page supplies transparent arithmetic; model selection, data quality, uncertainty, and operational decisions remain outside it.
When interpolation is part of a repeated table or chart, keep the endpoint convention stable across every row. One row with reversed pairing or a different unit scale can look like an isolated anomaly while still producing a finite value. Record the data preparation step, the target domain check, and the display precision used for the report so a later reviewer can separate source preparation from interpolation arithmetic.
A straight segment can be understood as the unique affine function that matches both endpoints. That view explains why equal increments in x produce equal increments in y and why a midpoint has the average value. It also makes the model limitation clear: an affine function has no mechanism for curvature, a jump, saturation, or a delayed response. Those behaviors must be supplied by another model or by additional data.
If the endpoints are observations taken at different times, interpolation represents an assumed value between those times, not a measurement collected at the target. The target may be a time, distance, or index, but the meaning of the fraction remains a modeling choice. Confirm that the process is ordered and that the endpoints bracket the target in the relevant domain before treating the estimate as useful.
For an implementation review, compare the weighted form with the slope form using values that include negative coordinates, descending y values, fractional endpoints, and targets very near both boundaries. Check that an accepted endpoint returns the paired value without an unintended extrapolation branch. Then check that invalid ordering and out-of-range targets fail before division. These cases expose both arithmetic mistakes and accidental coercion.
A displayed result can be copied into a chart, but a chart does not add evidence that the interpolated path is real. Label estimated points as estimates when that distinction matters. If a later reader sees only a smooth line, they may mistake a visualization choice for observed data. Keeping the fraction, endpoint status, and model name in the calculation record avoids that ambiguity.
When a source contains more than two observations, choose the neighboring endpoints deliberately and document the selection rule. Different neighboring pairs can produce different local estimates in a curved series. The calculator does not search for the nearest points or select a cell; it applies the five supplied values exactly. Data selection and interpolation are separate stages and should remain auditable separately.
The interpolation fraction also provides a sensitivity reading for the endpoint values. A small change in y0 is multiplied by 1 - t, while a small change in y1 is multiplied by t. A small change in x affects t through the interval width, so narrow intervals can make the estimate more sensitive to target rounding. These observations describe the declared formula; they do not replace a formal uncertainty analysis for measured data.
If the target is a timestamp, determine whether the numeric scale is elapsed time or a calendar encoding before subtracting endpoints. Calendar labels can have discontinuities or unequal intervals that are not represented by ordinary numeric distance. Convert them to an ordered continuous scale first, then document that preparation beside the five calculator inputs.
A robust caller should preserve both successful results and explicit domain errors. An empty fallback, a repeated endpoint average, or a silently clamped target can make a data pipeline appear complete while changing the model. Keeping the error visible allows a reviewer to distinguish missing coverage from a genuine interpolated value and to choose a separate extrapolation or repair policy deliberately.
If interpolation is used to drive a chart, distinguish known endpoint markers from estimated interior markers. This is both a communication and a data-integrity issue. A smooth visual line can imply observations that were never collected. Keeping the target, fraction, and estimate status in the record prevents a display layer from erasing the boundary between source data and model output.
Estimate y at an in-range x between two ordered points using a straight-line interpolation fraction.
t = (x - x0)/(x1 - x0); y = (1 - t)y0 + ty1, for x0 < x1 and x0 <= x <= x1. Linear interpolation uses the fraction of the horizontal interval reached by x and applies the same fraction between y0 and y1. Reversed or equal endpoints and out-of-range targets are rejected.
Enter First x0, Second x1, First y0, Second y1, Target x, then choose Calculate.
The two endpoint x values are ordered with x0 less than x1, and x lies in the closed interval between them. The relationship between the endpoint pairs is modeled as a straight line; no curvature, uncertainty, or extrapolation is inferred.
This calculator is part of the WorldCalculate library. Its formula, example, assumptions, input bounds, and output formatting follow the official methodology.
These WorldCalculate collections connect this tool with related questions while keeping each calculation separate and transparent.