
Goal
Calculate the static-period degree of operating leverage from contribution margin and operating income.
Worldwide context
Saved once here, used across the site.
Currency changes display only. Country selection guides tax input; no tax rate is guessed.
Calculate the static-period degree of operating leverage from contribution margin and operating income.
Degree of operating leverage = contribution margin / operating income.A clearer path to an answer
This page keeps the calculation transparent: define the goal, enter the matching values, inspect the method, and decide what the result means in your situation.
Calculate the static-period degree of operating leverage from contribution margin and operating income.
Contribution margin · Operating income
Degree of operating leverage = contribution margin / operating income.
Calculate, review the assumptions below, then compare a related tool when the decision needs more context.
Calculate the static-period degree of operating leverage from contribution margin and operating income.
Open the Degree of Operating Leverage Calculator pageMore business tools
Download PDFDownload Word (.doc)
Enter your values above and choose Calculate to see the result here.
Calculation map
Degree of operating leverage = contribution margin / operating income.
Bounded, transparent calculation
Your recent runs stay in this browser session only.
Formula: Degree of operating leverage = contribution margin / operating income.
Degree of operating leverage compares contribution margin with operating income for one period. It describes how much operating income is represented by the contribution margin under the entered results. The calculator does not convert the ratio into a forecast or claim that a future sales change will produce a guaranteed outcome.
Worked example: Degree of operating leverage is 4.0000 times.
The displayed limits are checked before the handler runs. Model-specific domain checks may also reject impossible or non-finite inputs.
Methodology: This calculator follows the WorldCalculate input, formula, precision, and boundary policy. Read the official methodology.
Calculator usage statistics
This section counts anonymous successful Calculate submissions, not unique visitors. Counts and top tools appear only when trusted aggregate data is available; country analysis is shown only under the same condition and reporting threshold.
Answer-first guide
Calculate the static-period degree of operating leverage from contribution margin and operating income. Start with one clearly defined goal, enter values in the units shown, and keep the result attached to the assumptions below.
This tool is useful when your question includes degree of operating leverage, DOL, contribution margin. It returns the outputs declared in the calculator contract rather than a live quote, approval, diagnosis, or professional sign-off.
Contribution margin · Operating income. Keep the same time period, unit system, and currency wherever the form requires comparable values.
Run the worked example first, compare its output with the page's example, then change one input at a time. This makes an unexpected result easier to trace to a unit, boundary, or assumption.
Need a wider view? Browse Business Calculators or compare the related tools below. The WorldCalculate methodology explains how formulas, examples, limits, and revisions are reviewed.
Degree of operating leverage = contribution margin / operating income.
Degree of operating leverage compares contribution margin with operating income for one period. It describes how much operating income is represented by the contribution margin under the entered results. The calculator does not convert the ratio into a forecast or claim that a future sales change will produce a guaranteed outcome.
Degree of operating leverage is 4.0000 times.
Context and background
Business tools separate revenue, cost, margin, markup, cash, time, and return so a planning decision can be checked one layer at a time.
Management accounting and operating analysis use ratios and thresholds to make business performance easier to compare. The right denominator and period are part of the answer, not a hidden detail.
Research and review
Researched by Hassan ALRowaie, Founder and editorial researcher at WorldCalculate.
This guide follows the live calculator's declared inputs, formula, worked example, assumptions, validation boundaries, and source-backed methodology. The review date describes editorial review of the calculator explanation; it is not a promise that external facts or rates remain current.
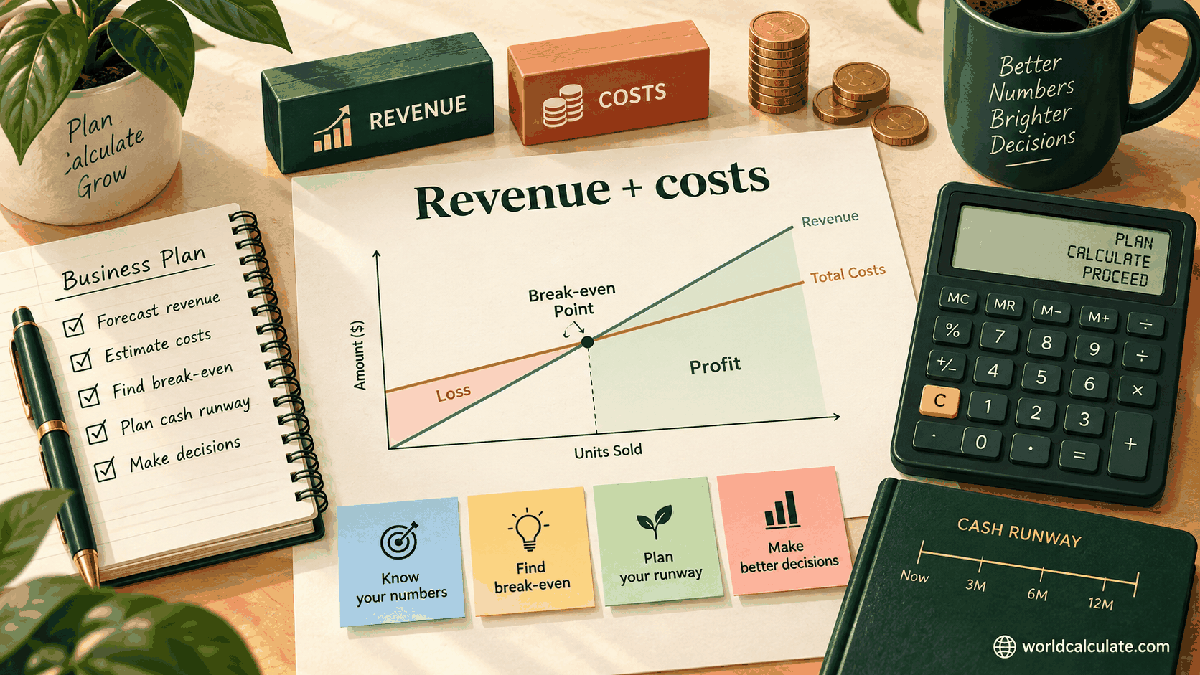
The degree of operating leverage compares contribution margin with operating income for one selected period. Enter those two prepared values, and this calculator divides contribution margin by operating income to produce a static-period ratio. A result of 4 means the entered contribution margin is four times the entered operating income. The ratio can help explain why a change in sales may have a proportionally different effect on operating income when fixed costs are present, but this page does not make a forecast. It does not predict demand, earnings, risk, or future volatility. This guide explains the two inputs, the formula, positive and negative cases, examples, relation to fixed costs, and the limits of using one period's result as a planning signal.
Degree of operating leverage, commonly abbreviated DOL, is a ratio of contribution margin to operating income. The contribution margin is the amount left after variable costs under the chosen statement or management analysis. Operating income is the operating result before interest and taxes under the same period and classification. The calculator reports the quotient and repeats the two amounts so the ratio can be checked rather than read as an isolated score.
With contribution margin of 40,000 and operating income of 10,000, DOL is 40,000 / 10,000 = 4.0000 times. The result describes the relationship in the entered period. It does not mean that a 1 percent future sales change will always create a 4 percent operating-income change. That interpretation requires stable prices, variable-cost behavior, fixed costs, volume range, and other assumptions that are not entered here.
Operating leverage exists because some costs do not change directly with each unit or sale in the short run. The contribution margin covers fixed operating costs and then leaves operating income. When operating income is small relative to contribution margin, the quotient can be large. The mathematical sensitivity can be useful to notice, but it also makes the ratio unstable near break-even. The page keeps that instability visible by rejecting only a zero denominator.
A negative ratio can be valid when operating income is negative. The calculator preserves the sign rather than applying an absolute value. A negative operating result changes the interpretation of a static ratio and may indicate that the chosen period is below the operating break-even point. The page does not attach a verdict or a recovery recommendation to that case.
Contribution margin is commonly calculated as sales minus variable costs. Variable costs change with the selected activity measure under the chosen model, while fixed operating costs are not subtracted at this stage. The calculator asks for the prepared contribution-margin amount rather than sales and variable-cost fields. This keeps the page focused on the ratio and avoids silently choosing a cost-classification method for the user.
Use a contribution margin from the same period as operating income. If sales are monthly and variable costs are annual, the difference is not a valid monthly contribution margin. If one amount uses dollars and the other uses thousands, the result can be off by a factor of 1,000. Record the period, currency, volume base, and classification method before entering the figure.
Contribution margin can be negative when variable costs exceed sales under the entered scenario. The handler permits negative values because the ratio arithmetic can still be finite. A negative contribution margin usually needs careful review of pricing, variable-cost definitions, volume, or data, but the calculator does not diagnose the reason. It reports the entered result without converting it into a recommendation.
Do not use gross profit automatically as contribution margin. Gross profit may subtract costs classified as cost of goods sold, while contribution margin separates variable from fixed behavior for a specific analysis. The terms can overlap in a simple setting but are not universally identical. Follow the definition used by the source model and keep it with the value.
Operating income is the result after the operating costs included in the chosen statement or model and before financing and tax items under the stated convention. It is the denominator of DOL. The calculator accepts positive and negative operating income but rejects zero. A zero denominator has no finite ratio and is especially important because it often corresponds to an operating break-even point where leverage sensitivity becomes very large or undefined.
Use an operating-income figure built from the same revenue, variable-cost, fixed-cost, and period assumptions as the contribution margin. Combining a contribution margin from one product line with total-company operating income can answer a different question from the one intended. Similarly, a forecast operating income should not be silently compared with historical contribution margin. Keep scope and scenario labels visible.
Operating income is not net income. Interest expense, taxes, extraordinary items, and other nonoperating results can change net income without changing the operating denominator used here. Do not enter net income merely because it is the easiest number on a summary report. If the source only provides another measure, determine whether it is appropriate before treating it as operating income.
If operating income is very close to zero, small changes in the entered value can produce large changes in DOL. That is a mathematical property of division, not a reason to round the denominator away from zero. Preserve the source precision and interpret the result cautiously.
The formula is DOL = contribution margin / operating income. For contribution margin of 40,000 and operating income of 10,000, divide 40,000 by 10,000 to obtain 4. The unit is times because both values are in the same currency. The page also returns the input amounts so a reviewer can verify that the numerator and denominator came from the intended statement or scenario.
The ratio is sometimes explained through a small-change relationship: at a stable point, the degree of operating leverage can approximate the percentage change in operating income divided by the percentage change in sales. That explanation is conditional. It assumes a relevant range in which price, variable-cost rate, and fixed operating costs behave as modeled. The calculator does not test or guarantee those assumptions.
A contribution margin of 60,000 and operating income of 15,000 also produces 4.0000 times. The amounts are larger, but the relationship is the same. A contribution margin of 20,000 and operating income of 10,000 produces 2.0000 times. Comparing the component values is important because equal ratios can occur at very different scales and business structures.
If contribution margin is 40,000 and operating income is negative 10,000, DOL is negative 4.0000 times. The signed result is not a typo. It reflects the negative denominator under the defined formula. The page does not reinterpret the value as positive or label it as a forecast of future losses.
In a simple cost-volume-profit model, operating income can be represented as contribution margin minus fixed operating costs. This relationship explains why DOL can exceed one when contribution margin is larger than operating income. For example, contribution margin of 40,000 and operating income of 10,000 imply 30,000 of fixed operating costs under that simple bridge. The calculator does not compute or verify the fixed-cost amount, but the relationship can aid interpretation.
As operating income approaches zero while contribution margin remains positive, the quotient grows in magnitude. This is why a near-break-even scenario can show a very high DOL. A large ratio should not be treated as precise evidence about a future change. Small measurement, classification, or volume differences can move the denominator substantially relative to its size.
At operating break-even, contribution margin equals fixed operating costs and operating income is zero. The DOL formula is undefined there. The handler rejects exactly zero rather than displaying infinity. If your analysis is close to that point, report the underlying contribution margin and operating income and consider a separate break-even calculation with its own inputs.
The fixed-cost relationship is a model assumption, not a universal description of every organization. Some costs step up, mix fixed and variable behavior, or change with capacity. The page does not force those costs into a binary classification. Use the contribution margin and operating income definitions that belong to the specific analysis.
You can use the page to compare prepared scenarios by changing one input at a time. Holding contribution margin at 40,000 and changing operating income from 10,000 to 20,000 changes DOL from 4 to 2. Holding operating income at 10,000 and changing contribution margin from 40,000 to 50,000 changes DOL from 4 to 5. These are direct consequences of the formula, not forecasts of how sales will produce the inputs.
For a historical comparison, use the same period length and accounting definitions. A ratio change may reflect price, volume, product mix, variable-cost behavior, fixed-cost changes, one-time items, or classification. The calculator cannot attribute the movement. Read the two component amounts and the supporting income statement before explaining why DOL changed.
For planning, build the scenario outside the page. Decide expected sales, unit price, variable cost, fixed cost, and activity range, then derive contribution margin and operating income. Enter those derived values here as a transparent ratio check. Keep base, upside, and downside scenarios separate. Combining them into one average can hide the very sensitivity the metric is meant to highlight.
Do not use the ratio to claim that a future sales increase or decrease will have a specific percentage effect. The approximation can fail when fixed costs step, prices change, variable costs change, volume leaves the relevant range, or the business mix changes. The calculator's narrow contract is intentional so it does not invent those missing assumptions.
DOL concerns operating results. Degree of financial leverage concerns financing effects, and combined leverage can combine operating and financial sensitivity under a broader model. This page does not calculate either companion measure. Do not infer interest or debt behavior from DOL. An organization can have high operating leverage with little debt, or low operating leverage with significant financing exposure.
Contribution margin ratio expresses contribution margin as a share of sales, while DOL divides contribution margin by operating income. The numerator may be related, but the denominators and questions differ. A contribution margin ratio helps discuss each sales unit's contribution toward fixed costs, while DOL describes the relationship between contribution margin and current operating income.
Break-even units and break-even revenue use fixed costs, contribution margin per unit, or contribution margin ratio. DOL uses an operating-income denominator. The metrics can inform one another in a carefully defined model but should not be substituted. If operating income is zero, a break-even calculation may still be appropriate while DOL is undefined.
A common question is whether a higher DOL is always bad. No universal answer follows from the quotient. It can indicate a larger fixed-cost component under one model, but the same number can arise from different scales and classifications. The calculator reports the ratio without an automatic good or bad label.
To prepare contribution margin, identify the sales and variable-cost definitions used by the chosen operating analysis. Subtract variable costs from sales under that model, then keep the resulting amount separate from operating income. Operating income includes the operating costs required by the statement or scenario, including the fixed-cost effect that remains after contribution margin. The calculator accepts the two prepared results and does not recalculate either one from hidden assumptions.
Scope should be consistent. A product-line contribution margin can be useful with product-line operating income, while total-company operating income may include costs that the product line does not carry. A monthly contribution margin can likewise be paired with monthly operating income, not an annual denominator chosen because it is readily available. Write the entity, segment, period, currency, and activity basis alongside the inputs.
Cost behavior is an analytical classification, not simply a label on a general-ledger account. A cost may be fixed within one relevant range and step up outside it. A mixed cost may need a documented split. The calculator does not decide that classification, and its finite result does not confirm it. If the classification changes between scenarios, show that change rather than presenting the new quotient as a pure volume effect.
Near break-even, the denominator deserves more attention than the rounded ratio. Operating income of 10,000 with contribution margin of 40,000 gives 4 times, but operating income of 1,000 with the same contribution margin gives 40 times. The second result is mathematically valid and much more sensitive to a small reporting or modeling difference. Keep the underlying amounts visible and avoid false precision in a business explanation.
A negative operating-income case can be useful for understanding the sign behavior of the formula. It does not make the ratio a loss forecast, and it should not be repaired by taking an absolute value. If the purpose is to locate break-even, use fixed costs and contribution-margin information in a separate break-even model. DOL can be discussed beside that model, but it cannot replace the inputs it does not request.
For a historical series, preserve the original reported values before preparing any adjusted case. If one period includes a one-time charge or a changed cost allocation, document the adjustment and run reported and adjusted ratios separately. This makes the calculation reproducible and prevents a convenient DOL value from being used to conceal a change in the underlying statement.
A useful DOL record begins with the operating statement or scenario worksheet that supplies contribution margin and operating income. Note whether contribution margin is based on total sales, one product line, or a particular activity range. Note which operating costs are included in operating income. The formula then remains reproducible even if a later reviewer would choose a different classification for another analysis.
Use the same period and scale for both values. If a monthly scenario is compared with a quarterly statement, state the conversion or do not compare the ratios. If a forecast is used, retain the sales, variable-cost, fixed-cost, and volume assumptions outside this page. A ratio based on prepared values is transparent only when the preparation is transparent too.
The sign is evidence, not decoration. A positive contribution margin with positive operating income produces a positive ratio, while a loss denominator can produce a negative ratio. A large positive or negative quotient near zero operating income should be reported with the raw denominator and a caution about sensitivity. Do not hide an unstable case behind a rounded whole number.
For a meeting or dashboard, phrase the output narrowly: it is the entered contribution margin divided by the entered operating income for the selected period. Avoid adding a claim about future sales, cost flexibility, profitability, or business quality. Those claims need a broader model and evidence that the two-input calculator intentionally does not collect.
The page has two aggregate inputs and one ratio. It does not verify sales, classify costs, forecast demand, model capacity, account for taxes or interest, or calculate a probability of loss. It cannot determine whether an operating-income figure is sustainable or whether fixed costs can be changed. Those limitations keep the result tied to the entered period rather than a hidden business forecast.
Financial operating figures can be confidential. Do not enter customer names, account credentials, tax identifiers, confidential contracts, or unnecessary transaction details into the page. Share only the aggregate values and context needed for a review. Keep the period, currency, and cost definitions attached when the result is exported or discussed.
A common question is whether a negative DOL means the handler is wrong. It does not; a negative operating-income denominator produces a negative quotient under the formula. Another question is whether a very large result is precise. Near-zero operating income makes the ratio sensitive, so preserve inputs and avoid overstating the display. If operating income is zero, use a different analysis rather than forcing a value.
Use this page for education, a transparent static-period comparison, and a prepared cost-volume-profit scenario. For pricing, staffing, expansion, borrowing, investment, or formal reporting decisions, review the full model and source records with an appropriate finance or accounting professional.
Calculate the static-period degree of operating leverage from contribution margin and operating income.
Degree of operating leverage = contribution margin / operating income. Degree of operating leverage compares contribution margin with operating income for one period. It describes how much operating income is represented by the contribution margin under the entered results. The calculator does not convert the ratio into a forecast or claim that a future sales change will produce a guaranteed outcome.
Enter Contribution margin, Operating income, then choose Calculate.
Contribution margin and operating income use the same period and currency, with costs already classified by the user. Operating income cannot be zero; negative inputs are preserved as descriptive scenarios rather than converted into advice.
This calculator is part of the WorldCalculate library. Its formula, example, assumptions, input bounds, and output formatting follow the official methodology.
These WorldCalculate collections connect this tool with related questions while keeping each calculation separate and transparent.